Ing Jesus Vasquez - Data Analyst
"Front-End Developer & Power BI Specialist. I build web apps and strategic dashboards that turn data into action. Experienced in React, JavaScript, Artificial Intelligence, and advanced data visualization to deliver impactful metrics."

I specialize in building impactful dashboards with Power BI that help teams visualize performance, track goals, and uncover insights. By turning business data into clear, compelling narratives — from KPI tracking to executive-level reporting — I focus on creating tools that drive smart decisions.
Dashboard Examples
Call Center Analytics & KPI Dashboards
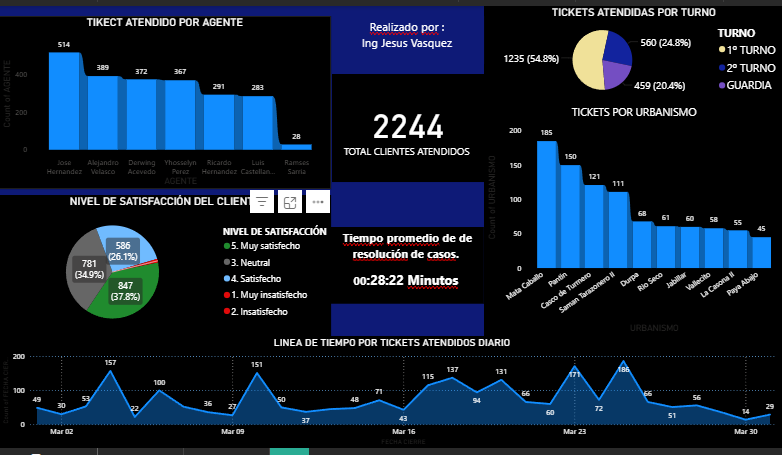
This dashboard monitors call center activity and performance metrics, helping teams track service levels, agent productivity, and customer satisfaction in real time.
Technical Support Performance Dashboards
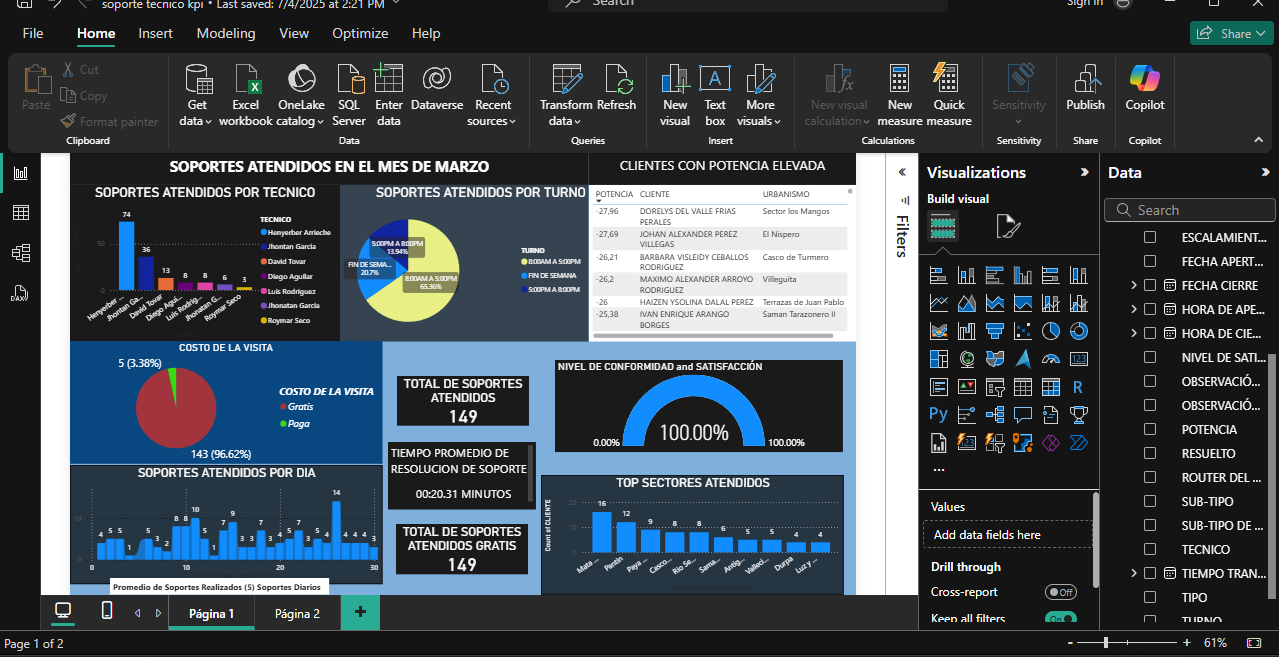
This dashboard tracks technical support efficiency by measuring ticket volumes, resolution times, and issue categories, helping support teams deliver faster, higher-quality service.
Operational Command Center Dashboard
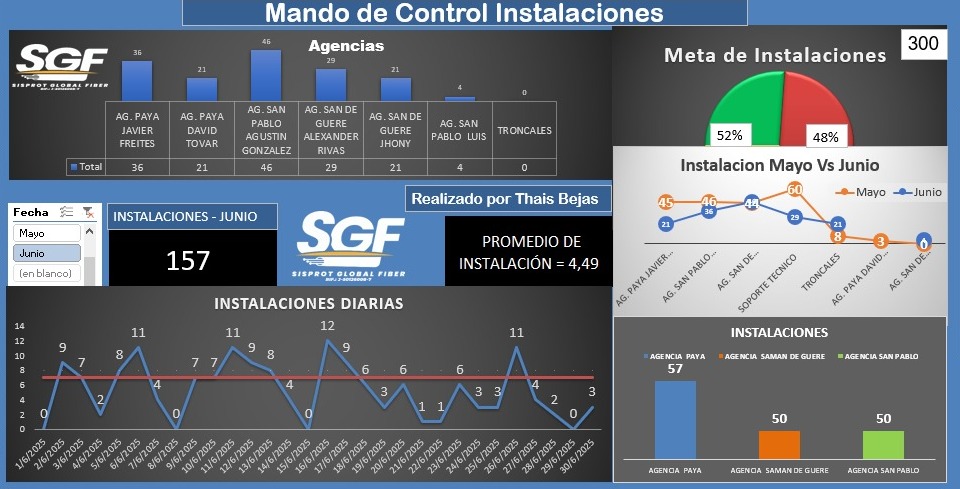
This dashboard provides centralized visibility into key operational metrics, allowing managers to oversee processes, resource usage, and performance indicators across departments in real time.
HR Analytics & Workforce Insights Dashboard
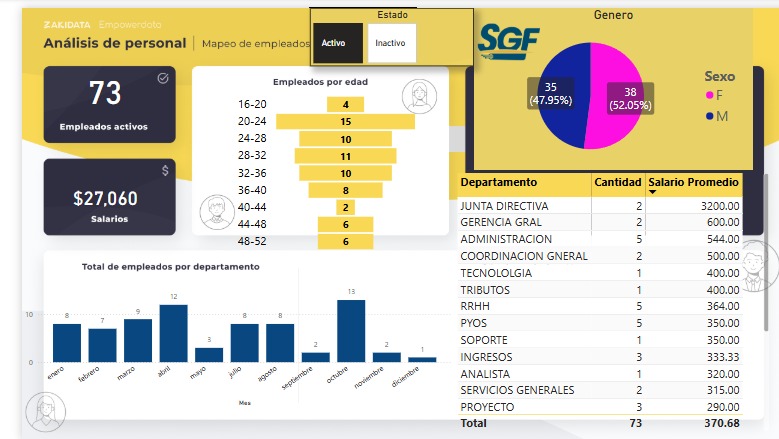
This HR dashboard provides a visual overview of key workforce data, enabling leadership to monitor trends, support strategic planning, and make data-driven decisions. Built in Power BI, it offers an intuitive layout and interactive elements for efficient analysis.
Incoming Analytics & Administration Dashboard
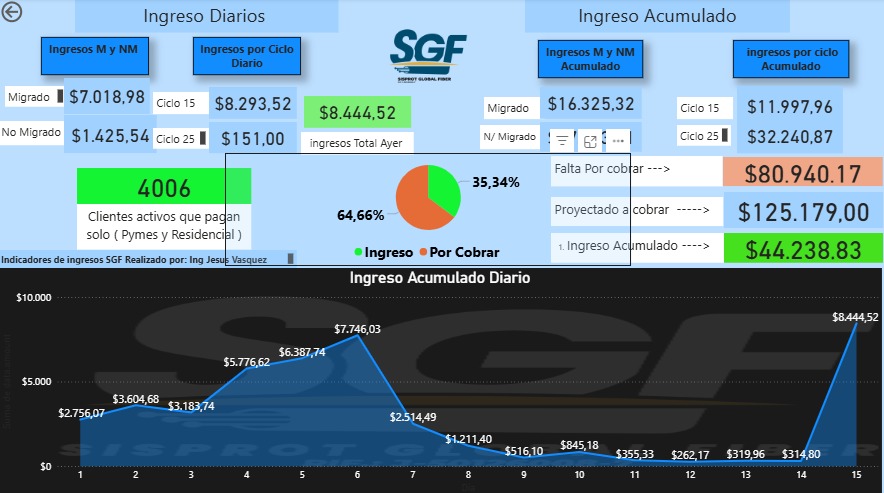
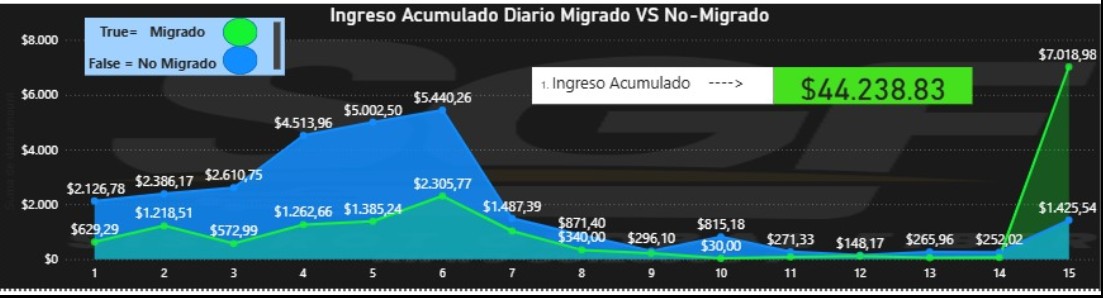
This revenue dashboard offers a clear and interactive view of the company's financial performance. Designed in Power BI, it supports administrative teams in tracking income trends, identifying growth opportunities, and enhancing financial decision-making.